DECISION TREES
How decision trees split data with if/then rules, why they overfit, and when Random Forests and boosting beat a single tree.
Part of: AIA decision tree is a supervised machine learning model that predicts by asking a sequence of simple questions about the input — “is credit score above 720?”, “is debt-to-income under 0.35?” — until it reaches a leaf that holds the prediction. Each root-to-leaf path is an explicit rule a human can read, challenge, or put in a policy document.
That transparency is why trees still matter next to deep learning: they are not always the most accurate model on every dataset, but they are among the easiest to explain, debug, and defend.
How a Decision Tree Makes a Prediction
- Start with the full training set at the root.
- Choose the single split (feature + threshold or category group) that most improves purity of the two child groups.
- Recurse on each child until a stop rule hits (max depth, min samples per leaf, or pure leaves).
- At prediction time, walk the same questions from root to leaf and return the leaf’s class vote or average value.
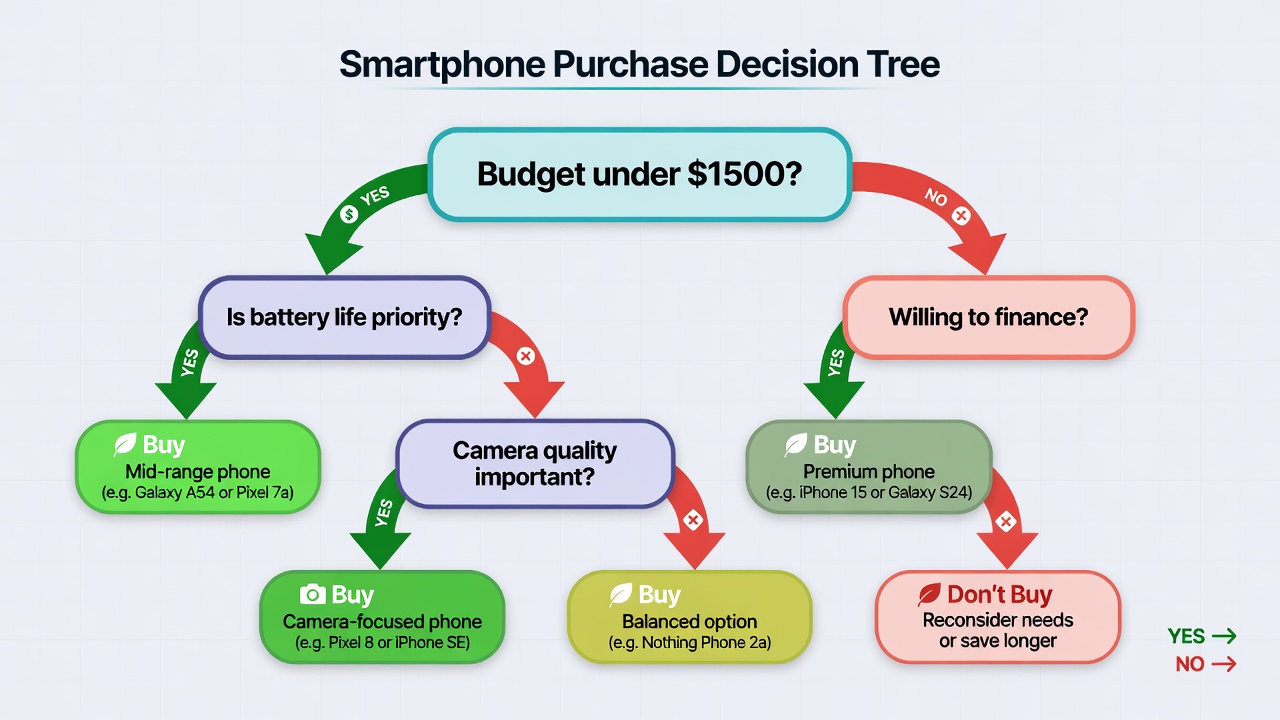
Root → decision nodes → leaves. Every path is a complete, auditable rule.
Example path in credit underwriting: if credit score > 720 and debt-to-income < 0.35 → Approve. That sentence is the model for that region of the feature space.
What “Purity” Means (Gini and Entropy)
At each candidate split the algorithm scores how mixed the labels are before and after.
| Measure | Intuition | Common use |
|---|---|---|
| Gini impurity | Probability of mislabeling if you pick a class at random from the node’s mix | Default in many CART-style implementations |
| Entropy / information gain | How much uncertainty (in bits) the split removes | Classic ID3/C4.5-style trees |
You do not need to derive the formulas to use trees well — but you do need the idea: good splits make child nodes more homogeneous than the parent.
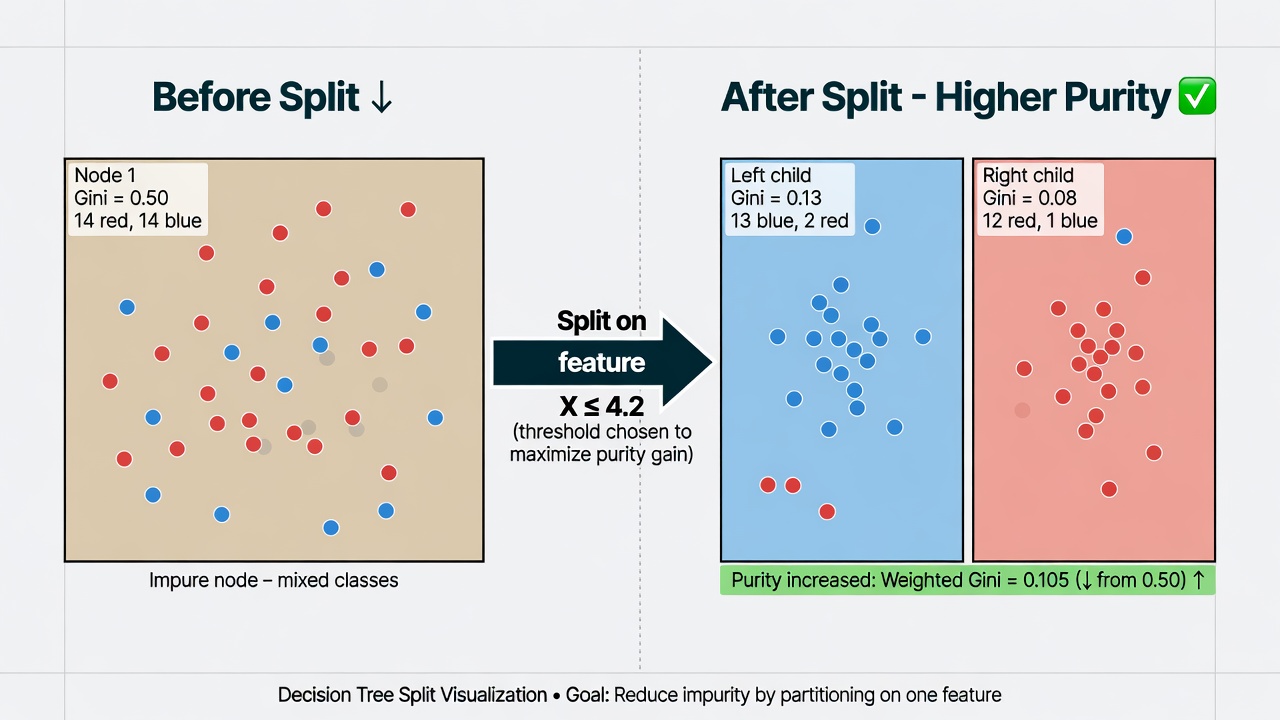
A strong split turns a mixed parent into children that are mostly one class each.
Watch: Decision Trees Explained Visually
VIDEO — STATQUEST (JOSH STARMER)
Clear visual walkthrough of growth, Gini/information gain, and why deep single trees overfit.
Why Businesses and Regulators Still Rely on Trees
- Audit trails — You can reconstruct why a score flipped without a separate explainer model.
- Mixed tabular data — Numbers and categories in one model with light preprocessing.
- Few distributional assumptions — No requirement that relationships be linear or errors be Gaussian (contrast linear regression).
- Feature importance as a byproduct — Features used higher and more often in splits tend to drive predictions (with caveats: correlated features steal credit from each other).
That combination keeps tree-based models common in credit risk, fraud, insurance pricing, claims triage, and operations — domains where “show your work” is not optional.
The Overfitting Problem — and Why Ensembles Won
A single tree can grow until every leaf is pure on the training set. Train accuracy looks perfect; test accuracy often collapses. The tree memorized noise.
Industry response: ensembles of trees.
| Method | How it works | Typical use |
|---|---|---|
| Random Forest | Many trees on random row/feature subsets; average or majority vote | Strong default for tabular data; resistant to single-tree brittleness |
| Gradient boosting (XGBoost, LightGBM, CatBoost) | Trees added in sequence, each fixing residual error of the current ensemble | Often wins leaderboards and production leaderboards on structured data |
Almost all serious production “tree models” today are forests or boosters, not a lone deep CART tree. The single tree remains invaluable for explanation and exploratory analysis even when the deployed model is an ensemble.
Decision Trees vs Linear Models vs Neural Nets
| Need | Prefer |
|---|---|
| Continuous target, roughly linear, need a fast baseline | Linear regression |
| Tabular data, interactions, mixed types, explainable paths | Trees → then forests/boosting |
| Images, audio, free text as primary signal | Neural nets (trees are a weak fit alone) |
| Must report metrics properly on holdout data | Always pair with model evaluation |
Trees and neural nets are not enemies: boosted trees still dominate many structured business tables, while deep models dominate unstructured media.
When to Use Them (and When Not To)
Use trees or ensembles when:
- Stakeholders must understand or challenge individual decisions.
- Features interact (risk only spikes when two conditions co-occur).
- Columns mix categories and numbers.
- You want a strong tabular baseline before building something heavier.
Be careful when:
- The job is image/speech/language modeling end-to-end — start elsewhere.
- You need a globally simple equation rather than a piecewise rule set.
- You train a deep single tree without regularization or validation — that is how you ship overfit policy.
Practical Workflow: Shallow Tree First
Before you train 500 boosted trees:
- Fit one shallow tree (
max_depth3–4). - Print the paths; read them aloud with a domain expert.
- Fix data leaks, weird thresholds, and mislabeled cases the tree exposes.
- Only then scale to a forest or booster and measure on a proper holdout (model evaluation).
That shallow tree is often worth more than a 0.3% leaderboard gain: it is a hypothesis generator about your business logic.
Limitations (Be Honest With Stakeholders)
- Axis-aligned splits struggle with diagonal decision boundaries unless the tree grows deep (and then overfits).
- Instability — small data changes can rewire the top splits of a single tree (ensembles dampen this).
- Extrapolation — leaves do not invent smooth trends outside the training range the way some parametric models do.
- Ensemble opacity — a 300-tree model is less “printable” than one tree; you trade pure transparency for accuracy and must invest in global/local explanation if regulation demands it.
Related Reading
- 5 Essential Machine Learning Algorithms Explained Simply — trees in context of other core algorithms
- Building Your First ML Model — practical first build
- Machine Learning — the broader concept map
- Linear Regression — the linear baseline trees often beat on interactions
- Model Evaluation — how to know if the tree actually generalizes
- Tree-search and hierarchical agents — a different “tree” idea: search over reasoning paths, not feature splits
Decision trees remain the clearest bridge between statistical learning and human decision policy: simple enough to audit, powerful enough (especially as ensembles) to run real products on tabular data.
Part of the knowledge graph at The Best Blog Ever — reference definitions for ideas that matter.