MODEL EVALUATION
How to measure whether a model works on your data and cost — not just public benchmarks — and how to keep checking after deploy.
Part of: AIModel evaluation is the discipline of measuring whether a model actually works for you — on your queries, your definition of success, and your unit economics — instead of trusting the scores published on a leaderboard.
It is a core layer of systems that work in production: without it, you are guessing which model to buy, when quality is slipping, and whether a “better” release note is real.
Why Public Benchmarks Mislead
Every model ships with a headline number. One scores 92% on a public suite, another 91%, and the leaderboard invites you to crown a winner. For your product, that ranking is often noise.
| Property of benchmarks | What it means for you |
|---|---|
| Curated | Misses 3 a.m. garbage inputs, half-formed questions, and domain slang |
| Adversarial / edge-heavy | Scores edge skill, not average traffic quality |
| Static | Frozen while your product language and users move |
| Cost-blind | Ignores latency and $/query that dominate real systems |
Treat published scores as marketing context, not a purchasing decision.
Measuring on Your Own Distribution
The only evaluation that settles an argument is one run on your distribution.
- Collect 100–200+ real queries (or a stratified sample of production-like tasks).
- Attach ground truth or a scoring rubric (exact answer, must-cover points, “runs without error,” grounded in docs).
- Run every candidate model with the same prompts, tools, and retrieval setup.
- Score with your criteria — not a generic “helpfulness” vibe.
- Inspect the disagreement set: cases where models diverge. Totals often hide the real gap.
That workflow is the same A/B discipline used in prompt engineering: change one variable at a time so the result is attributable.
For RAG systems, correctness usually means grounded in retrieved sources, which is inseparable from retrieval quality and retrieval architecture.
Cost-Adjusted Evaluation
Raw accuracy is only half a decision.
| Model | Accuracy | Cost / query | Rough quality per dollar |
|---|---|---|---|
| A | 87% | $0.30 | Low |
| B | 85% | $0.10 | Higher |
A two-point accuracy loss against a threefold cost cut is often the right trade — then you route hard queries to the expensive model and keep the cheap one as default. That links evaluation to inference optimization.
Rule of thumb: report quality, cost, and latency together, or you will optimize the wrong leaderboard.
Benchmarks vs Real Evaluation
| Dimension | Benchmarks | Real evaluation |
|---|---|---|
| Data | Curated public sets | Your actual distribution |
| Diversity | Edge cases / exam style | Average case + real edges |
| Freshness | Static | Updated on a cadence |
| Cost & latency | Usually ignored | First-class metrics |
| Time | Single snapshot | Trend over months |
Real evaluation is more work. That is the point: it answers the only question that matters — does this model work for us, at a price we can sustain?
Degradation and Red Flags
A model that scored 95% offline can lose ground in production without a single deploy: user language drifts, seasonality shifts, or the offline set was cleaner than reality.
Watch for metrics that improve while users worsen:
- Offline accuracy up, acceptance down
- Longer answers, lower completion of tasks
- Faster responses, higher error or escalation rates
- Higher confidence alongside more hallucinations
When confidence and error rise together, scoring alone is not enough — you need verification as a gate on outputs, and feedback loops that turn failures into better tests.
Evaluation as a Cadence
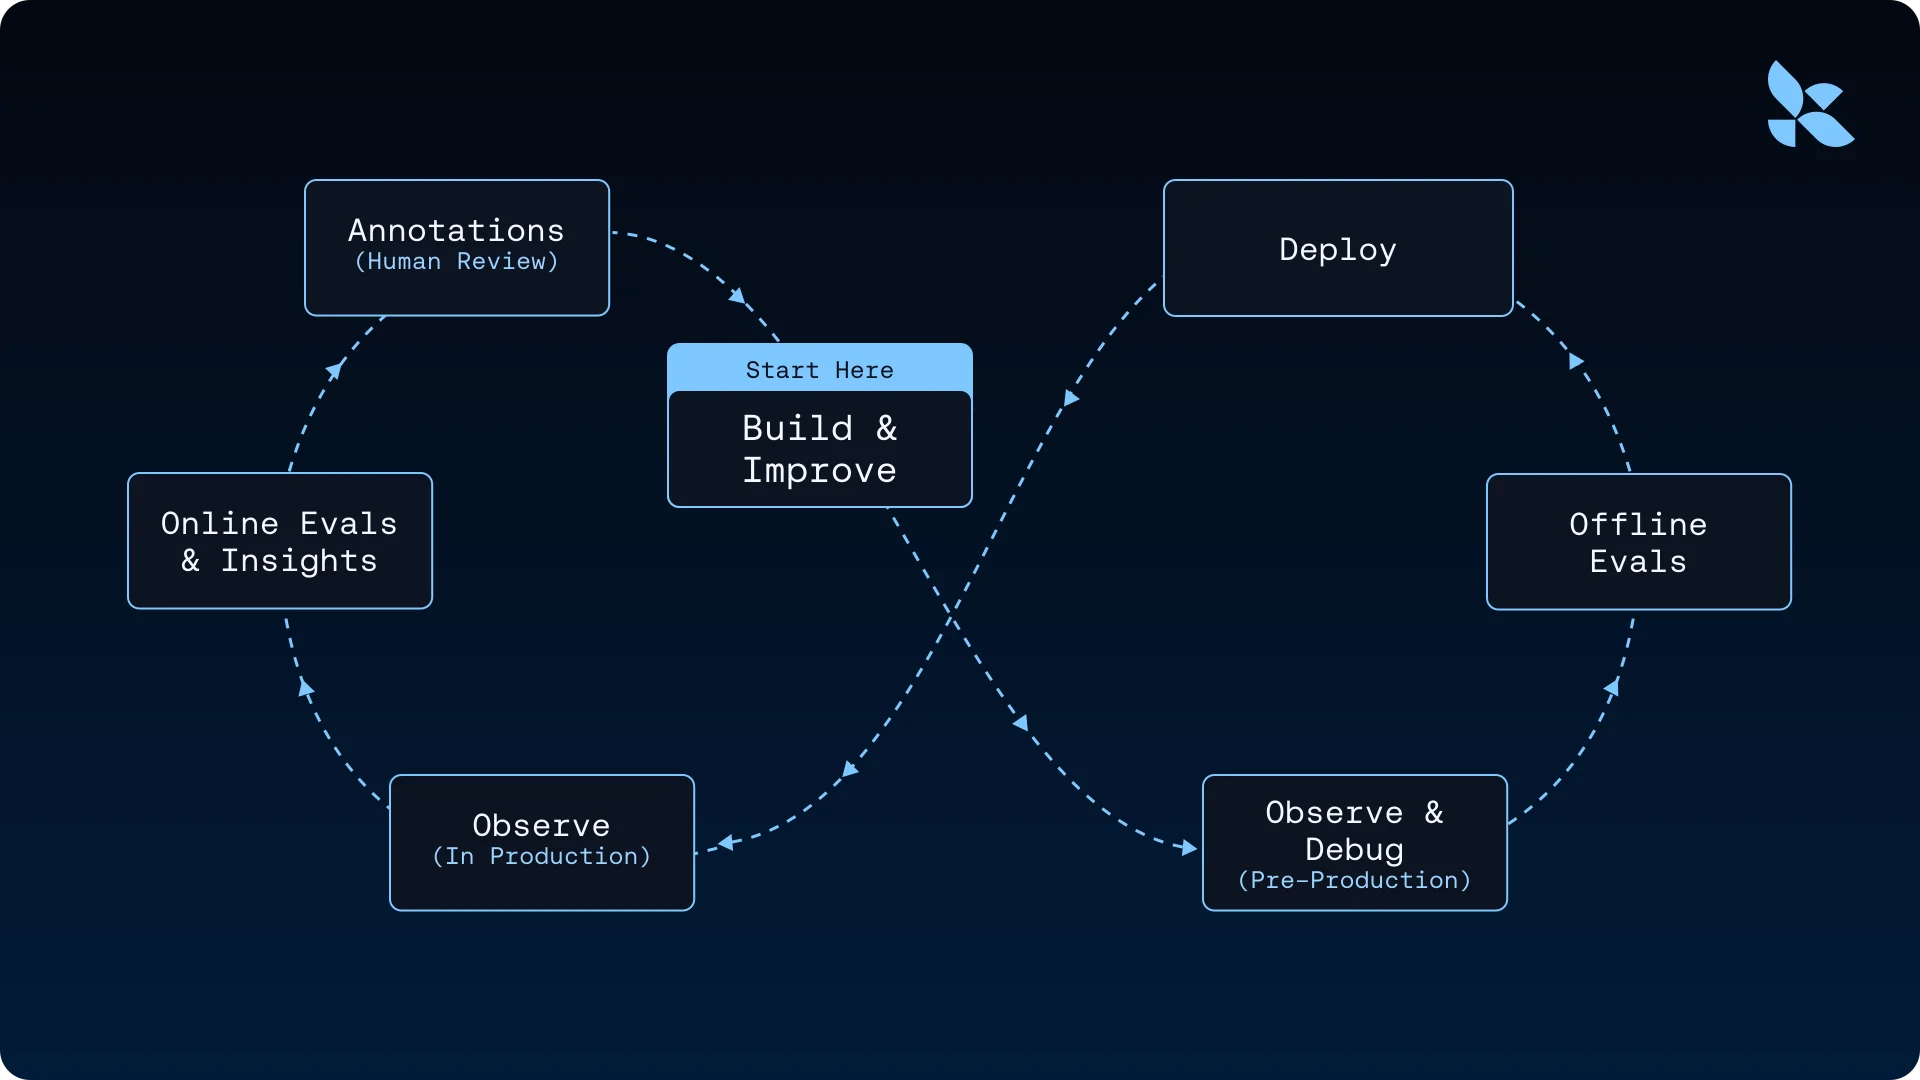
Evaluation is not a one-time gate. It is a schedule.
| Cadence | Action |
|---|---|
| Monthly | Re-run the offline set; catch drift |
| Quarterly | Compare against 1–2 alternatives |
| Yearly | Rebuild the set; product language has moved |
When a new model drops, the honest answer is the same: measure it on recent production-like queries — accuracy/rubric, preference, cost, latency — not release-note theater. For agent systems, evaluation expands to multi-step success; see evaluating AI agents and offline evals stacks.
Evaluation vs Verification vs Monitoring
| Practice | When | Question it answers |
|---|---|---|
| Evaluation | Offline / experiments | Which model or version should we ship? |
| Verification | Per request | Is this output safe/correct enough to show? |
| Monitoring | Production streams | Is quality or distribution drifting now? |
Skipping any one of these is how “it worked in the demo” becomes an incident.
Practical Starter Checklist
- Define success in one sentence (e.g. “answer grounded in our docs, no invented policy”).
- Build v1 offline set (100+ real tasks) with labels or rubrics.
- Freeze a prompt + tools + retrieval recipe so comparisons are fair.
- Score quality and cost/latency.
- Ship only if holdout beats the current baseline — or beats it on cost at acceptable quality.
- Calendar monthly re-runs; log production failures back into the set.
Limitations
- Rubrics for open-ended generation are subjective; use multiple raters or structured checklists.
- Offline sets can leak into training if you are not careful with vendor fine-tunes and public data.
- Perfect offline scores do not replace online experiments for UX and preference.
- Agent and multi-tool systems need task-level success metrics, not only single-turn accuracy.
Related Reading
- Building AI Systems That Actually Work — where evaluation sits in the stack
- Verification Is Not Optional — per-output gates
- Offline Evals and the Production Evaluation Stack — how teams operationalize evals
- Routing Queries to Models — cost-aware model choice
- Machine Learning — the broader learning map
- Linear Regression / Decision Trees — classic models still need honest holdout metrics
Model evaluation is how you replace vibes with evidence: not “is this model smart?” but “is this model good enough for us, still, at a price we can pay?”
Part of the knowledge graph at The Best Blog Ever — reference definitions for ideas that matter.