Earnings Exposure: Why AI Capex Split Wall Street Four Ways
Four companies, one week, near-identical capex increases — and opposite verdicts from the market. The dispersion was not about how much each company spent. It was about what the spending proved.
AI Overview
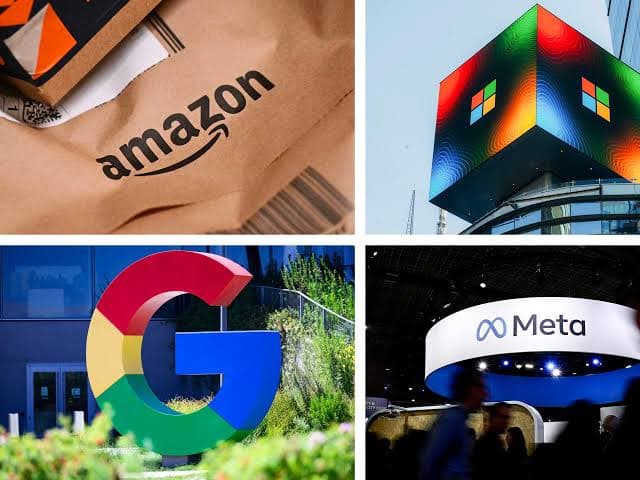
Meta, Microsoft, Amazon, and Alphabet all raised AI infrastructure spending guidance within the same nine-day window in July 2026, and Wall Street reacted in nearly opposite directions to what looked like the same story. Meta fell 9.6% after reporting; Alphabet fell about 3% despite beating revenue estimates; Amazon rose roughly 10%; Microsoft rose as much as 16%, adding hundreds of billions of dollars in market value. Capex size did not predict the reaction — Amazon's roughly $220 billion guide and Microsoft's $255-260 billion guide were both larger than Meta's $130-145 billion, and both were rewarded rather than punished. What predicted the reaction was a three-part pattern visible across all four earnings calls: whether the company showed discipline in how its cost curve was shaped (not just its size), whether current results already proved the spending was converting into paying demand, and whether management could describe the spending plan in specific, checkable terms rather than general confidence. Call this pattern Earnings Exposure. Microsoft and Amazon scored strong on all three and were rewarded; Meta scored weak on monetization proof and narrative clarity and was punished; Alphabet, strong on monetization but weak on cost discipline after its first negative free cash flow quarter since its 2004 IPO, landed in between. The framework explains the July 2026 dispersion better than the raw spending totals do, and it generalizes to the next company that converts cash into infrastructure ahead of proven demand.
Key Facts
| Category | Economics — Markets |
| Difficulty | Intermediate |
| Read time | 11 minutes |
| Search intent | Informational |
| Updated | August 11, 2026 |
Meta, Microsoft, Amazon, and Alphabet all reported earnings within nine days of each other in July 2026, and all four raised their AI infrastructure spending guidance. Alphabet lifted 2026 capex to $195-205 billion. Meta raised its floor to $130-145 billion. Amazon guided to roughly $220 billion. Microsoft guided fiscal 2027 capex to $255-260 billion. On the surface, four companies told the same story: AI is expensive, and we are spending more.
Wall Street did not treat it as the same story. Meta fell 9.6% in after-hours trading the night it reported. Alphabet fell about 3% despite beating revenue estimates. Amazon and Microsoft did the opposite — Amazon rose roughly 10%, and Microsoft rose as much as 16% over the trading days following its report, adding hundreds of billions of dollars in market capitalization each. The spending totals moved in the same direction. The stock prices did not.
That divergence is the actual story of the week, and it holds a repeatable lesson: when spending size stops explaining the market's reaction, three other variables usually do — whether the company controls its cost curve at the frontier, whether the spend is already converting into paying demand, and whether management can narrate the plan in specific, falsifiable terms. It is the lens this article uses to read all four reports side by side, in the spirit of the comparative read Ben Thompson applied to this same earnings week on Sharp Tech, though the analysis and figures here are built independently from public reporting.
Why it matters
Four of the most valuable companies in the world spent more on AI infrastructure in a single quarter than most economies spend on national infrastructure in a year, and the market's response to that spending is now the single largest driver of trillion-dollar swings in aggregate market value. Getting the "why" wrong — attributing Meta's decline to spending too much, or Microsoft's rally to spending wisely, without isolating what actually differed — leads investors, operators, and anyone budgeting AI infrastructure of their own to draw the wrong lesson from an expensive natural experiment.
The same week also functions as a live test of an idea explored across our economics coverage: that in the AI buildout, the surest profits accrue to the picks-and-shovels layer, while the model and application makers carry the demand risk. This earnings week shows that risk being priced in real time, differently for each company, based on how each one is managing it.
What actually happened, company by company
| Company | 2026 Capex Guidance | Stock Move | Key Signal |
|---|---|---|---|
| Alphabet (Google) | $195-205B (up from $180-190B) | ~-3% after-hours | First negative free cash flow (-$5.9B) since 2004 IPO, despite 82% cloud revenue growth |
| Meta | $130-145B (floor raised) | -9.6% after-hours | EPS missed estimates by ~14%; free cash flow fell to $784M on $31.1B quarterly capex |
| Amazon | ~$220B annually | ~+10% | First $200B+ revenue quarter ($200.61B); AWS grew 37%, fastest since 2021 |
| Microsoft | $255-260B (FY2027 guidance) | +16% | Azure grew 43%; commercial bookings backlog hit $678B (+84%); Copilot reached 30M paid seats |
Alphabet reported first, on July 22, and set an uneasy tone: strong headline growth (24% revenue growth, 82% growth in Google Cloud) undercut by a capex increase and, more specifically, by free cash flow turning negative for the first time since the company's 2004 IPO. Investors had tolerated rising AI spending for two years. A company that has generated positive free cash flow every year for two decades suddenly not doing so was a different kind of signal, and the stock fell even on a beat.
Meta reported a week later, on July 29, and fared worse. Earnings per share missed estimates by roughly 14%. Capital expenditure hit $31.1 billion for the quarter, nearly double the year-ago figure, and management raised the full-year capex floor to $130-145 billion. Free cash flow collapsed to $784 million. Meta's advertising business, the company's actual proven revenue engine, beat estimates — but the market did not credit that against the spending increase, because Meta offered no comparably concrete story for how the AI infrastructure spend converts into new revenue the way advertising already does.
Microsoft and Amazon reported on July 30 and 31 respectively, and both were rewarded for structurally the same behavior — large capex increases — because each paired the increase with evidence the spending was already working. Microsoft's Azure cloud business grew 43%, ahead of its own 39-40% guidance, and its commercial bookings backlog reached $678 billion, an 84% increase that functions as a forward demand signal rather than a promise. Copilot, Microsoft's AI product line, reported 30 million paid seats — a specific, countable number, not a vague usage claim. Amazon became the first company to report a quarterly revenue figure above $200 billion, and AWS grew 37%, its fastest pace since 2021.
Economic Framework
Reading the four reports as one event rather than four separate stories exposes a pattern the capex totals alone do not: the stock reaction tracked three variables far more consistently than it tracked spending size.
Frontier Cost Discipline asks whether a company is managing the shape of its spending curve, not just its total. Microsoft, for instance, extended the useful life it assigns to data center equipment and shifted more of its infrastructure to operating leases — accounting and structural choices that signal deliberate cost management around a large number, rather than the number simply growing on its own. A company that can explain why its capex curve bends the way it does is telling investors it has a plan for the spend, not just an appetite for it.
Monetization Proof asks whether current results already show the spending converting into revenue, not whether management expects it to eventually. Microsoft's 43% Azure growth and $678 billion backlog are monetization proof. Amazon's fastest AWS growth since 2021, arriving in the same quarter as its capex increase, is monetization proof. Meta's ad revenue beat is real, but it is not proof that the new AI capex specifically is producing new revenue — it is proof the existing business is healthy, which is a different claim. Alphabet's 82% cloud growth is genuine proof, which is likely why its stock fell only 3% rather than double digits, even with negative free cash flow working against it.
Narrative Clarity asks whether management can describe the spending plan in specific, checkable terms. A number of paid seats, a percentage backlog growth, a named accounting change — these are falsifiable claims that can be checked next quarter. A promise that "we believe AI will transform the business" is not. Microsoft's earnings call leaned on the former. Meta's leaned more on the latter, without an equivalent counterweight, and the market treated the difference as material.
| Company | Frontier Cost Discipline | Monetization Proof | Narrative Clarity | Stock Reaction |
|---|---|---|---|---|
| Microsoft | Strong (lease/useful-life changes) | Strong (Azure +43%, $678B backlog) | Strong (30M Copilot seats) | +16% |
| Amazon | Moderate | Strong (AWS +37%, first $200B quarter) | Moderate | +10% |
| Alphabet | Weak (first negative FCF since IPO) | Strong (cloud +82%) | Moderate | -3% |
| Meta | Weak (capex nearly doubled YoY) | Weak (no AI-specific revenue tie) | Weak | -9.6% |
The pattern holds: the two companies strong on all three axes were rewarded; the two weak on two or more axes were punished, roughly in proportion to how many axes were weak. Spending size, by contrast, predicts almost nothing here — Amazon's roughly $220 billion guide and Microsoft's $255-260 billion guide are both larger than Meta's $130-145 billion, and both were rewarded rather than punished for it.
The Earnings Exposure insight
The point of naming Earnings Exposure as a framework, rather than just narrating one earnings week, is that the same three questions apply to any company converting cash into infrastructure ahead of demonstrated demand — which describes a large and growing share of the market, not just four hyperscalers. A biotech company raising R&D spend, a retailer building out logistics infrastructure, a utility financing grid capacity for data centers: each faces the same three-axis test. Can they show cost discipline at scale? Is there already measurable proof the spend is converting? Can leadership describe the plan in numbers that can be checked later, not just confidence that can't be?
The predictive value of the framework is that it explains dispersion the raw spending number cannot. A reader tracking only "how much is company X spending on AI" would have expected Amazon's larger capex guide to draw a worse reaction than Meta's smaller one. The opposite happened, because the market was not pricing the spend — it was pricing exposure to the risk that the spend fails to convert, and that exposure is a function of proof and clarity, not dollars.
Limitations
This analysis covers one earnings week and four companies; it is a pattern, not a law, and it should be treated as a lens for the next round of earnings rather than a settled model. The three axes were scored qualitatively from public reporting, not from a formal quantitative model, and a different analyst could reasonably weight the same facts differently — Alphabet's -3% move, in particular, sits in a middle zone the framework describes less cleanly than Microsoft's or Meta's more extreme reactions.
The framework also cannot separate correlation from causation with only one data point: it is possible other factors — broader market conditions in late July 2026, sector rotation, analyst positioning ahead of earnings — contributed to the size of each move independent of the three axes described here. And because Alphabet's capex guidance is understood to increase further in 2027, and none of the four companies has yet reported the following quarter at the time of writing, whether the market's July verdicts prove correct is itself an open question the framework does not resolve.
Explore related coverage
- The economics of AI infrastructure — the pillar piece this article extends
- Who profits from the AI buildout — why picks-and-shovels suppliers carry less demand risk than model makers
- The real cost of AI compute — the cost structure behind the capex numbers in this piece
- Why power may be the real bottleneck for AI — the physical constraint behind the spending
- Related concept: capital allocation — the discipline each hyperscaler is being scored on in the framework above
References
- Alphabet earnings takeaways: Q2 revenue beats, GOOGL stock sinks on 2026 capex hike — CNBC, July 22, 2026
- Meta's stock drops on disappointing guidance, dwindling free cash flow — CNBC, July 29, 2026
- Meta Shares Slump 7% After Q2 Profit Falls 14% and Capex Guidance Raised — TradingKey
- The Week That Proved AI Is Real: MSFT +16%, AMZN +10%, META -10%, AAPL -4% — TradingKey
- Big Tech earnings slam into a market in revolt over AI spending — Fortune, July 26, 2026
- Amazon, Meta and Microsoft face skeptical investors this week after Google report sparked sell-off — CNBC, July 28, 2026
Final thoughts
The lesson of this earnings week is not that Microsoft and Amazon spent wisely while Meta and Alphabet spent recklessly — all four are betting enormous sums on the same underlying thesis, that AI infrastructure demand will justify the buildout. The lesson is that the market has stopped treating "we are spending on AI" as sufficient information, and started pricing the difference between spending that has already proven itself and spending that is still a promise. The next earnings cycle will apply the same three-axis test to whichever companies report next, and the framework here is the same one worth applying before the headline capex number arrives.
Read more on the economics of AI infrastructure, including who actually profits from the AI buildout, the real cost of AI compute, and why power, not chips, may be the binding constraint.
Explore Related Concepts
Frequently Asked Questions
Why did Meta stock drop but Microsoft stock rise after their AI earnings?
Both companies raised AI capex guidance in the same week, but investors read the spending differently. Microsoft paired its capex increase with 43% Azure growth, a $678 billion commercial backlog, and 30 million paid Copilot seats — concrete proof the spending was already converting into revenue. Meta raised its capex floor to $130-145 billion without an equivalent demand narrative, missed EPS estimates by roughly 14%, and saw free cash flow fall to $784 million. The market rewarded demonstrated monetization and punished spending without it.
How much did each company raise AI capex guidance in 2026?
In their most recent 2026 guidance: Alphabet raised full-year capex to $195-205 billion, up from $180-190 billion. Meta raised its 2026 capex floor to $130-145 billion. Amazon guided to roughly $220 billion annually. Microsoft guided fiscal 2027 capex to $255-260 billion. All four figures come from company earnings calls reported the same week.
Is Big Tech AI spending a bubble?
The earnings week analyzed here does not resolve that question either way — it shows the market applying different standards to different companies rather than treating all AI capex as equally risky or equally justified. Microsoft and Amazon were rewarded for capex tied to visible demand; Alphabet was penalized for capex paired with its first negative free cash flow quarter since its 2004 IPO; Meta was penalized for capex without a comparable demand story. That selectivity is itself evidence the market is pricing execution risk, not treating AI capex as a monolith.
What is the Earnings Exposure framework?
Earnings Exposure is a three-axis way to read any company reporting large infrastructure or R&D spending ahead of proven demand: Frontier Cost Discipline (is the company managing the cost curve of its buildout, not just the size), Monetization Proof (is current revenue growth already validating the spend), and Narrative Clarity (can management explain the spending plan in specific, falsifiable terms rather than general confidence). A company strong on all three tends to be rewarded regardless of how large the absolute spend is; weak on two or more, and the market punishes even modest increases.
Why did Alphabet stock fall despite beating earnings estimates?
Alphabet reported revenue growth of 24% and 82% growth in Google Cloud, both ahead of analyst expectations, yet shares still fell roughly 3% in after-hours trading. The reason was free cash flow: it turned negative by about $5.9 billion for the quarter, the first time that has happened since Alphabet's 2004 IPO, driven by the increase in AI capex guidance to $195-205 billion. Investors treated the cash-flow reversal as more significant than the revenue beat.